Exports
vConTACT3 generates several outputs to visualize and analyze genome clustering results. These are grouped into four main categories:
Graph-based outputs for network visualization
Cluster profiles for shared protein content
Other auxiliary outputs for completeness and intersections
ANI-based tables
Graph-based Outputs
Supported formats:
Cytoscape: JSON-formatted network with annotations, suitable for direct import into Cytoscape
GraphML: XML-based network format for use in numerous other network/graph-based tools
D3js: Interactive HTML network explorer (EXPERIMENTAL)
Cosmograph: Network visualization with annotated metadata using Cosmograph
REMINDER: Using the --breaks option will enable ALL of these to be separated into roughly even groupings of components. With 5-10K genomes in the reference databases alone, D3js and Cytoscape could struggle without this option enabled.
Example: Cytoscape Network
Generated with --exports cytoscape
To load/use these files, open Cytoscape and go to "File --> Import --> Network from file..."
Afterward, go to "Layout --> Apply Preferred Layout". Alternatively, use any layout that seems suitable. The network layout might take a while to "layout". After it finishes, there should be a large network along with many smaller networks adjacent to it in the network view window.
Note: Layouts are not provided as they can require exceedingly long times to calculate positions.
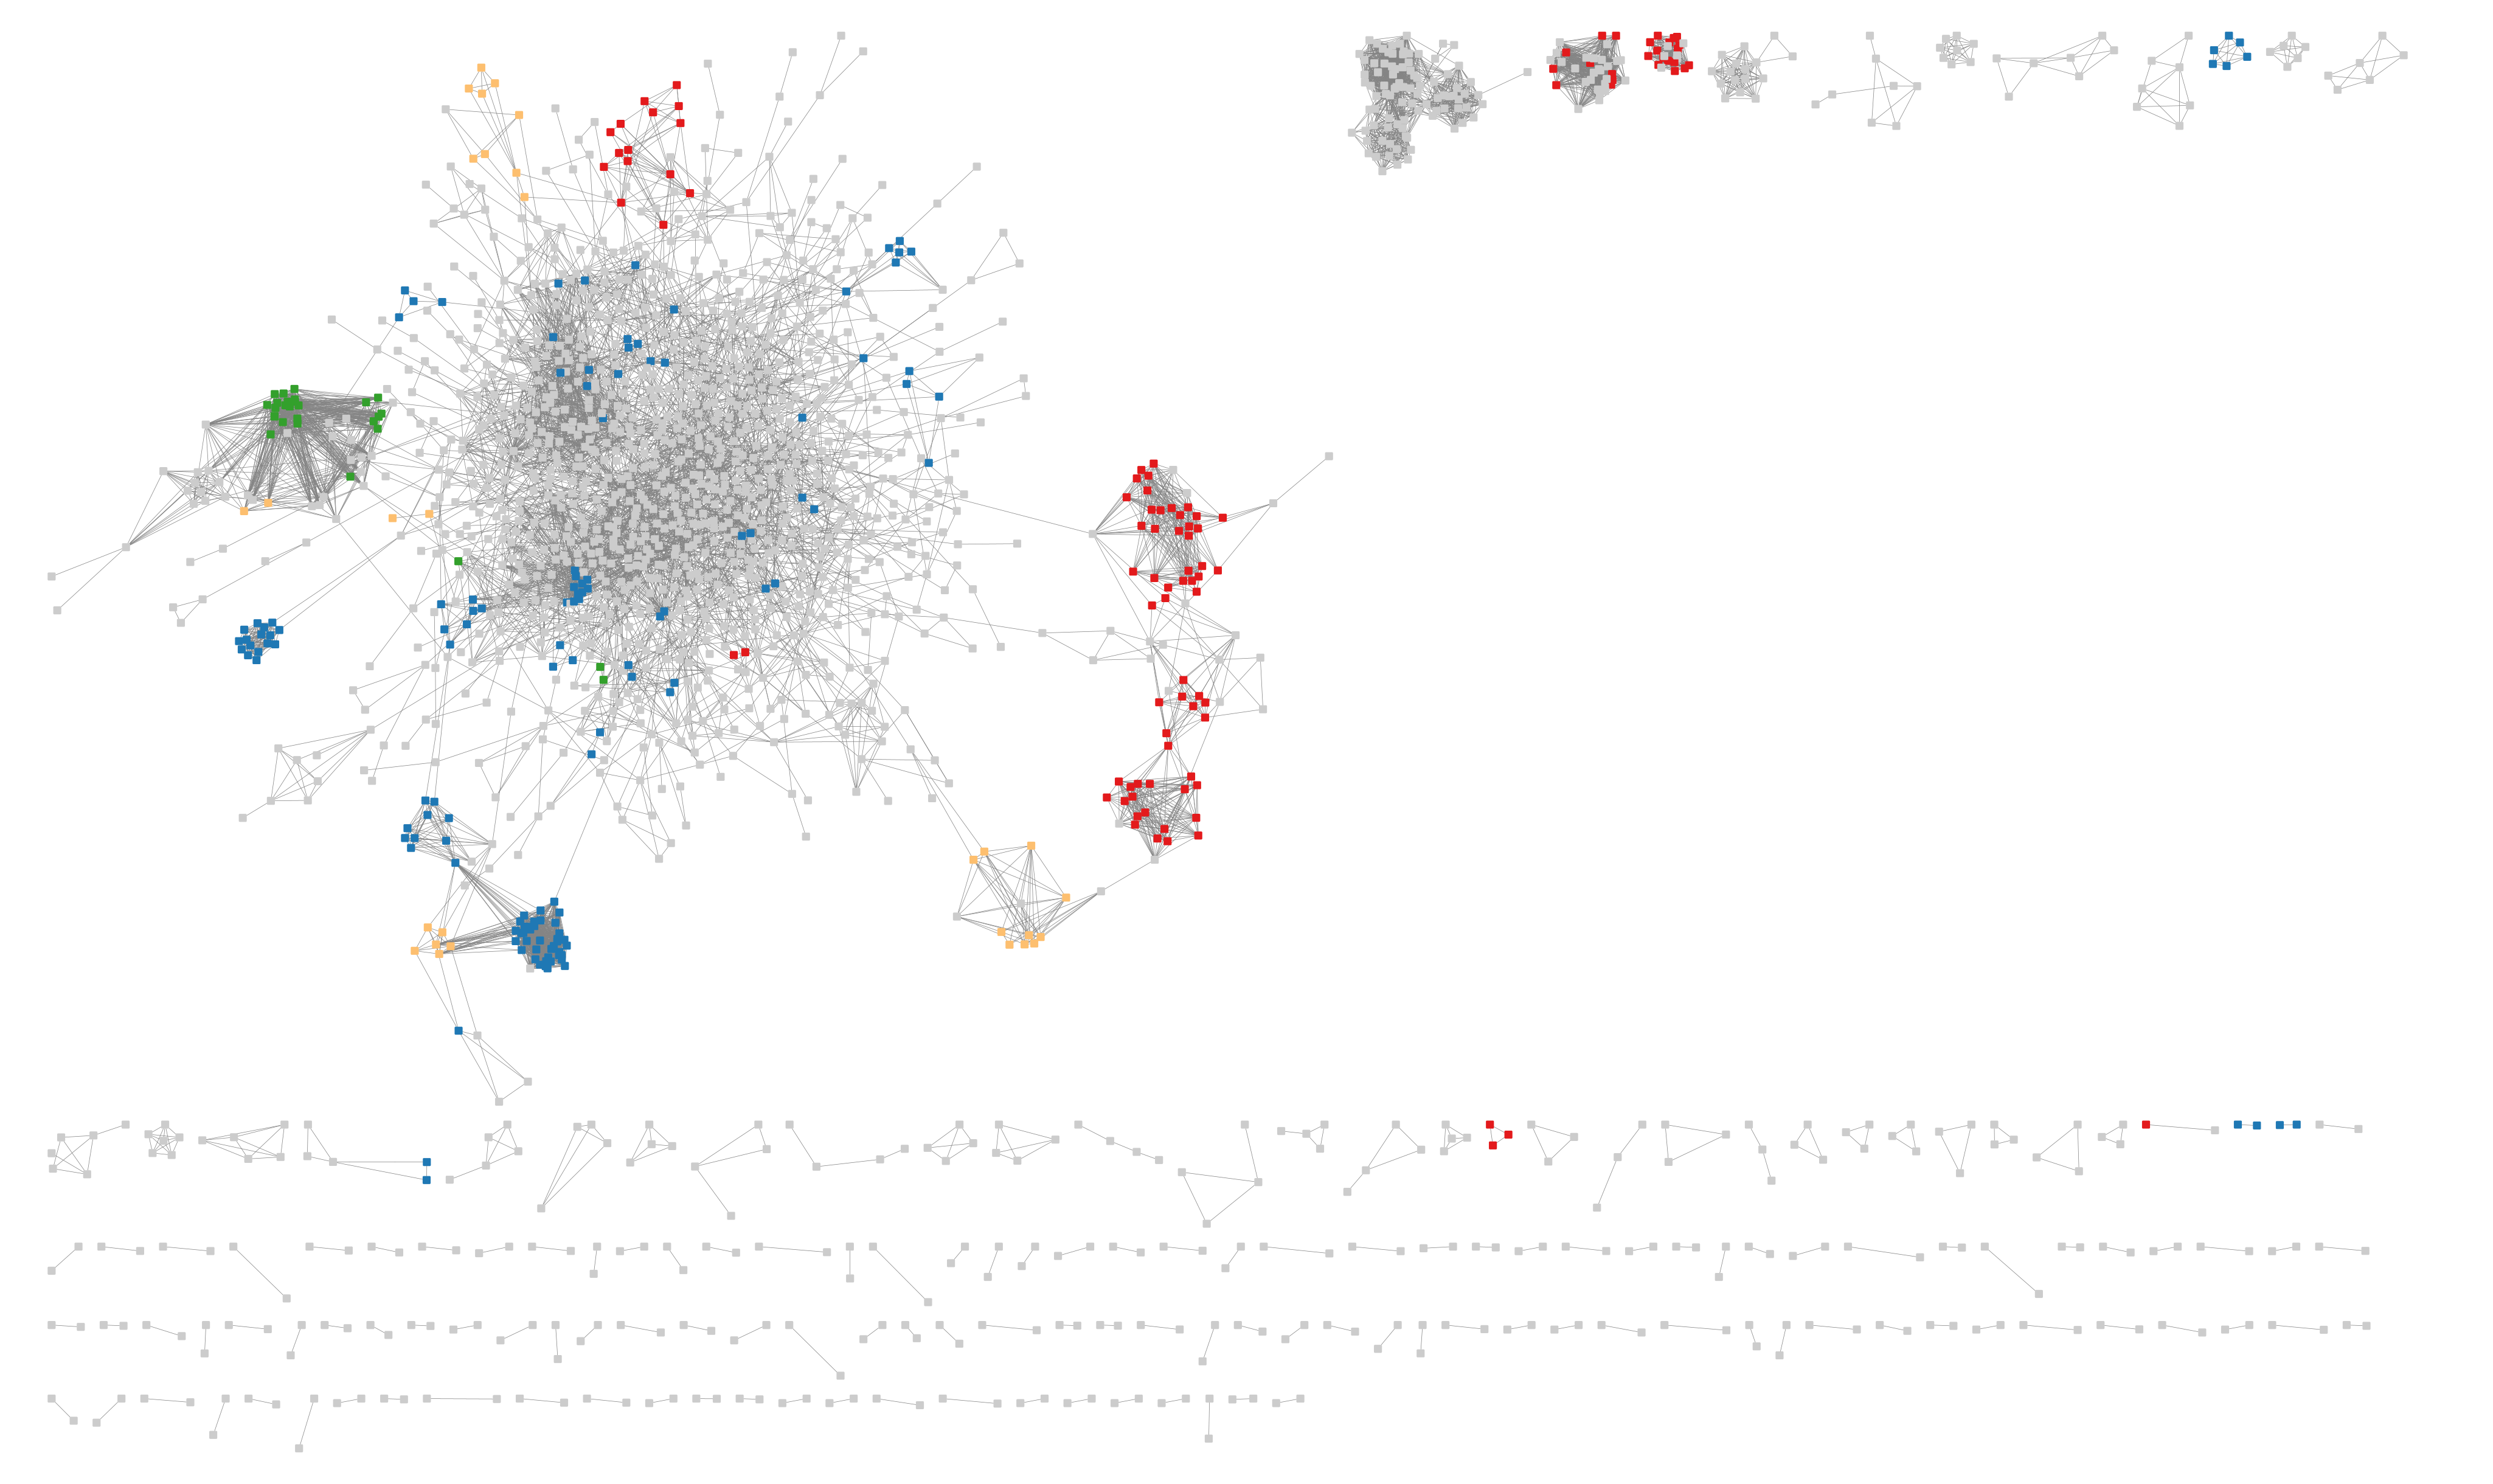
Example: Cosmograph Export
Generated with --exports cosmograph
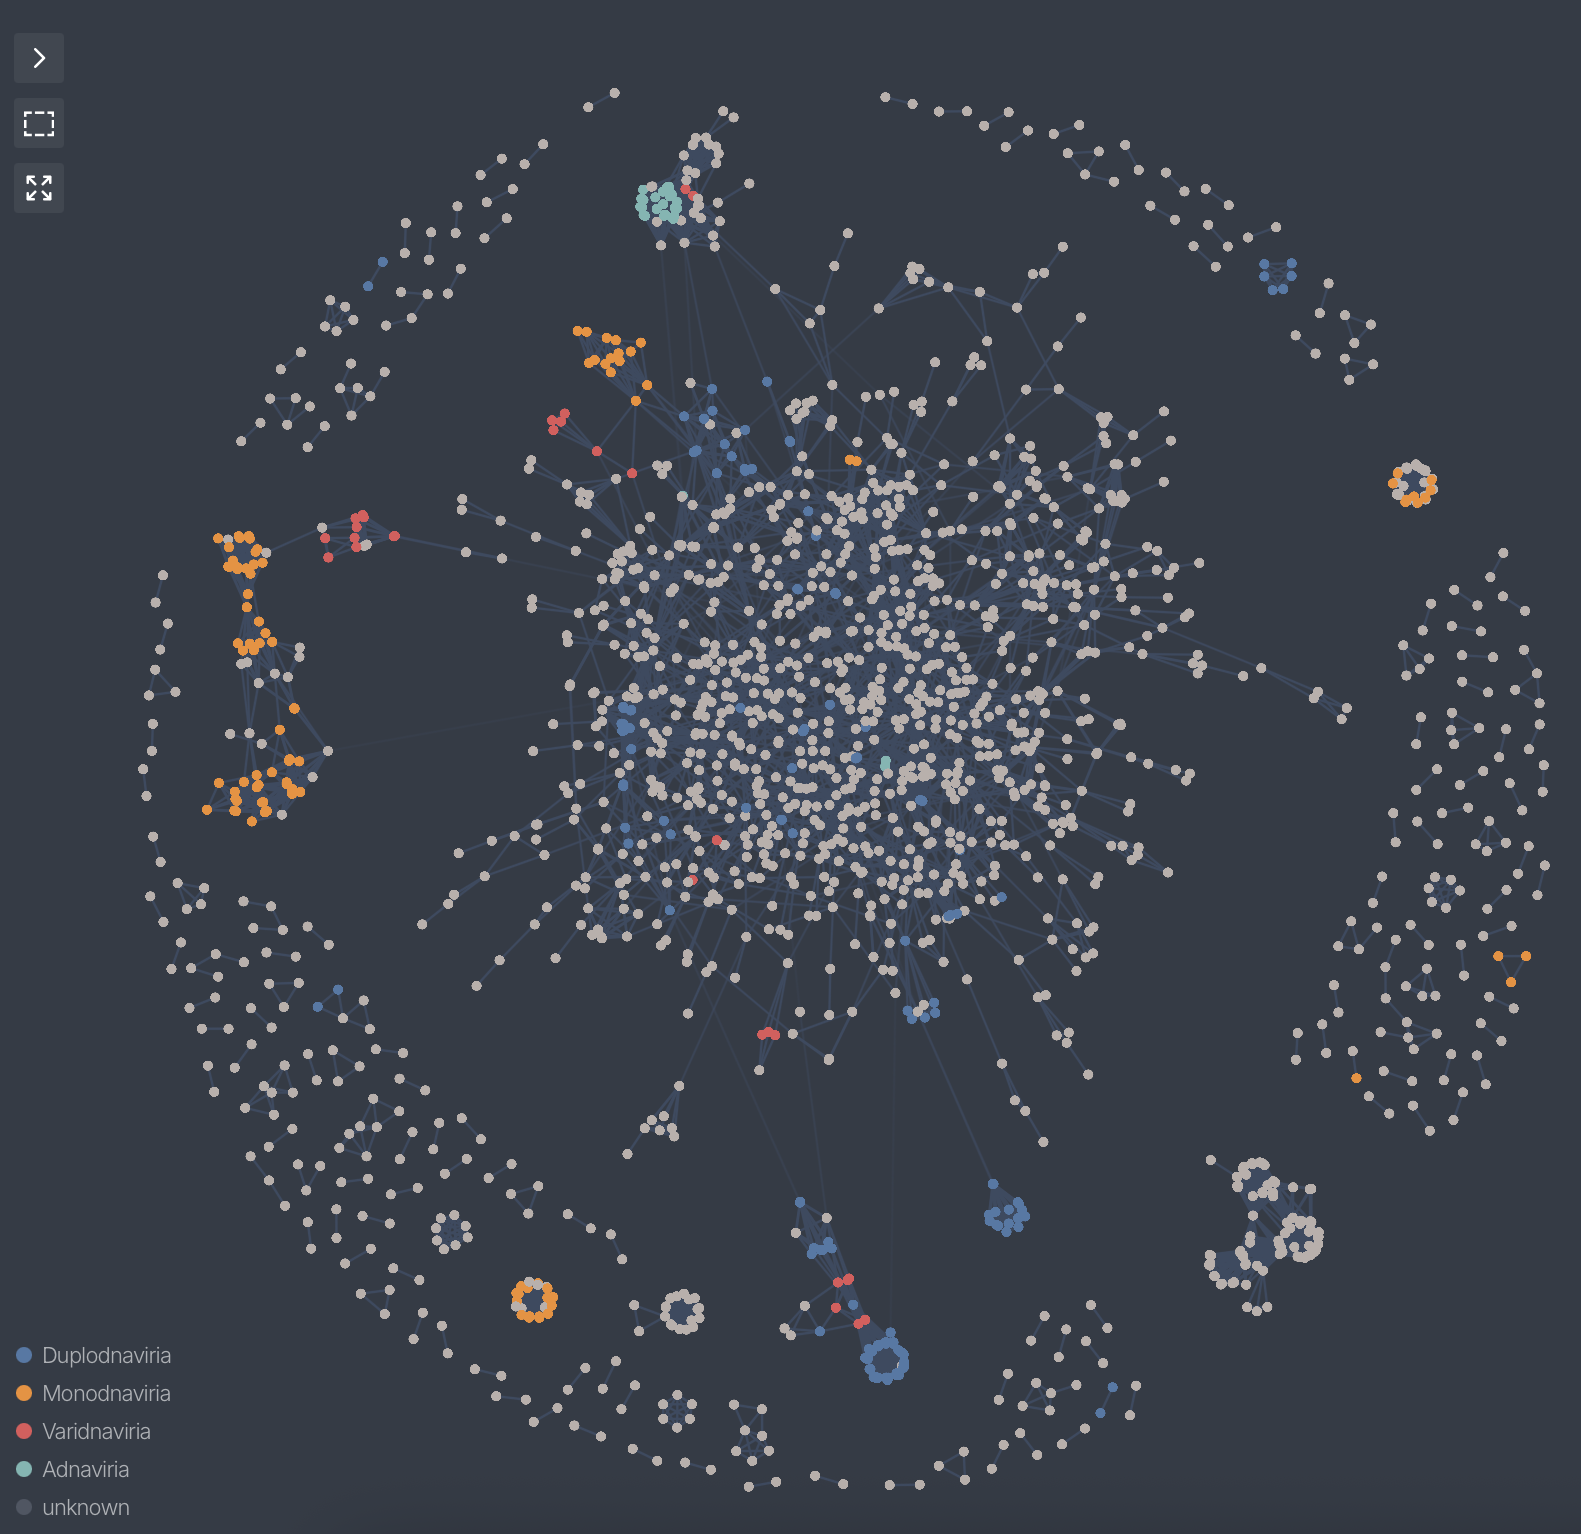
A GraphML export visualized in Gephi, showing clustered viral genomes based on shared gene content.
Example: D3js Interactive Network
(EXPERIMENTAL)
Generated with --exports d3js
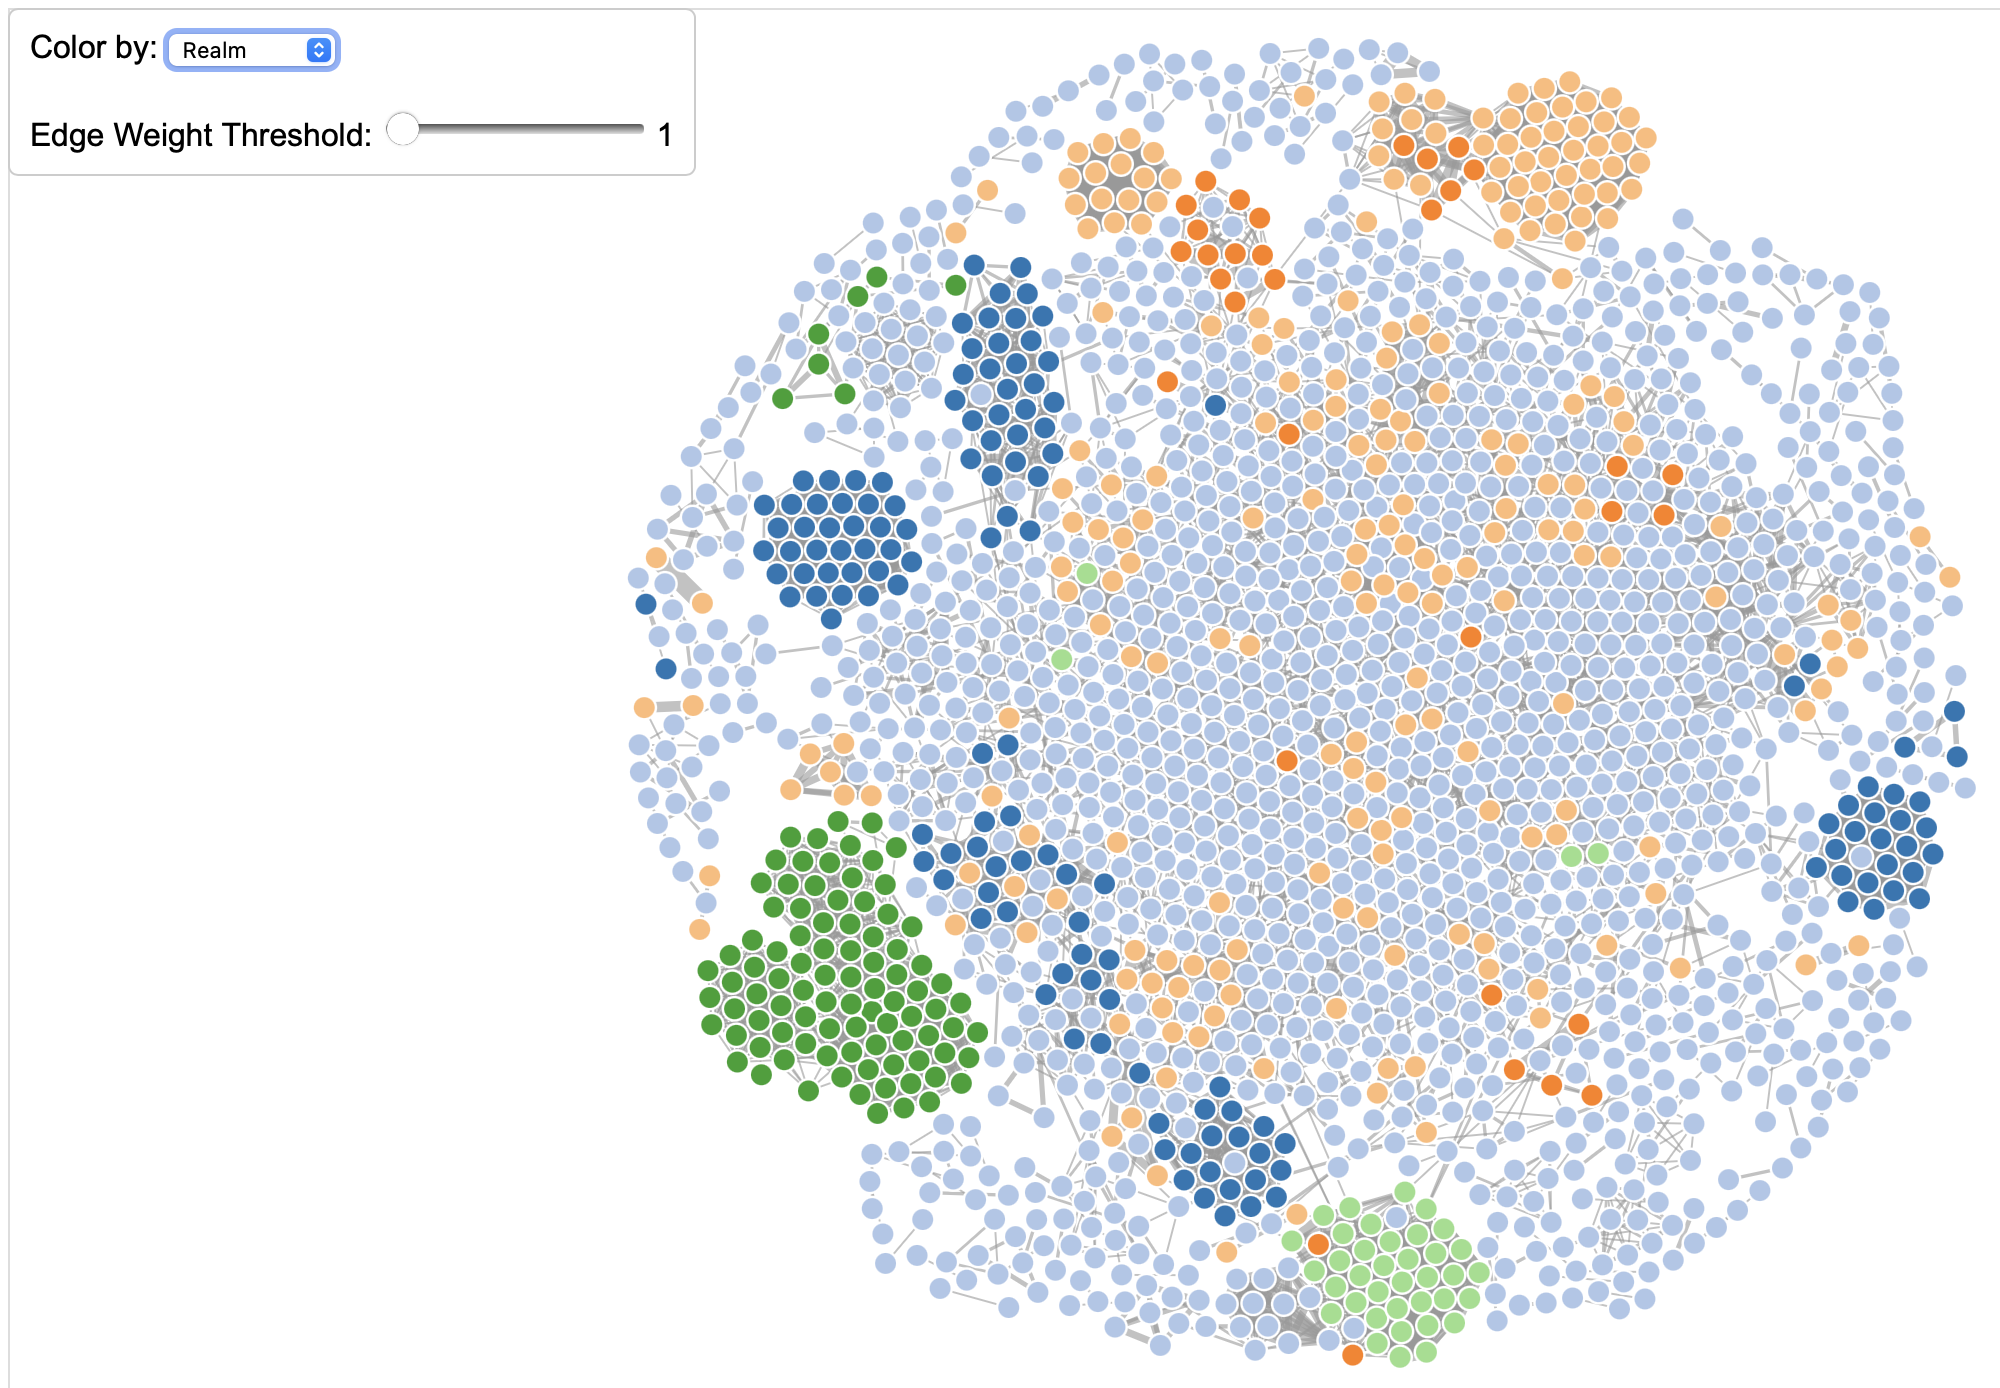
These are network/graph files suitable for rendering and interaction in a browser. There are at least 2 files for every exported group:
part#.d3.json
part#.d3.json.html
At the moment, coloring the nodes by attribute is enabled. Eventually, more options will become available.
Cluster Profiles
Generated with --exports profiles
Cluster profiles (also known as PC profiles, or just profiles), are matrices of genomes X PCs, with the presence or absence of a PC in a genome indicated by "1". The profile rank(s) are selected by --target-rank. If the user selects 'order' and 'family', then every single predicted order and every single predicted family will be exported. To reduce the number of potentially "insignificant" groups, the minimum number of genomes can be filtered by --target-members.
For every group predicted of that rank, the following files are generated:
rank_rank-name.svg (SVG heatmap)
rank_rank-name.csv (presence/absense PC counts)
Exported formats:
SVG: Visual profiles of shared protein clusters per taxonomic rank.
CSV: Tabular summaries of protein cluster distributions.
As mentioned in Inputs and Parameters, if selecting lower ranks (e.g. subfamily and genus) and/or the input dataset is large, this can result in 100s or 1000s of file pairs.
Example: Family-Level Protein Cluster Profile

A protein cluster profile visualizing shared gene content across genomes in the family Mesyanzhinovviridae.
Example: Family-Level Protein Cluster Profile CSV Export
CLU0003308 |
CLU0003651 |
CLU0003652 |
CLU0003653 |
CLU0003654 |
CLU0004868 |
CLU0004870 |
CLU0004871 |
CLU0004872 |
|
|---|---|---|---|---|---|---|---|---|---|
NC_026594.1 |
0 |
0 |
0 |
0 |
0 |
0 |
1 |
0 |
0 |
NC_028770.1 |
0 |
0 |
0 |
0 |
0 |
0 |
1 |
0 |
0 |
NC_042115.1 |
0 |
0 |
0 |
0 |
0 |
0 |
0 |
0 |
0 |
NC_052965.1 |
0 |
0 |
0 |
0 |
0 |
0 |
1 |
0 |
0 |
MT664984.1 |
0 |
0 |
0 |
0 |
0 |
0 |
0 |
0 |
0 |
NC_028931.1 |
0 |
0 |
0 |
0 |
0 |
0 |
0 |
0 |
0 |
ON932079.1 |
0 |
0 |
0 |
0 |
0 |
0 |
0 |
0 |
0 |
OP361299.1 |
0 |
0 |
0 |
0 |
0 |
0 |
0 |
0 |
0 |
OP380269.1 |
0 |
0 |
0 |
0 |
0 |
0 |
0 |
0 |
0 |
NC_047876.1 |
1 |
0 |
0 |
1 |
0 |
1 |
1 |
0 |
1 |
NC_047877.1 |
1 |
0 |
0 |
1 |
0 |
1 |
1 |
0 |
1 |
NC_047878.1 |
1 |
0 |
0 |
1 |
0 |
1 |
1 |
0 |
1 |
NC_047879.1 |
1 |
0 |
0 |
1 |
0 |
1 |
1 |
0 |
1 |
NC_007809.1 |
1 |
1 |
1 |
1 |
1 |
1 |
1 |
0 |
1 |
NC_010116.1 |
1 |
0 |
0 |
1 |
0 |
1 |
1 |
1 |
1 |
NC_018282.1 |
1 |
0 |
0 |
1 |
0 |
1 |
1 |
1 |
1 |
NC_028980.1 |
1 |
1 |
0 |
1 |
0 |
1 |
1 |
1 |
1 |
NC_041934.1 |
1 |
0 |
1 |
1 |
1 |
1 |
1 |
1 |
1 |
ON529854.1 |
0 |
0 |
0 |
0 |
0 |
0 |
0 |
0 |
0 |
A CSV summary of protein cluster counts per genome of family Mesyanzhinovviridae.
ANI-based genome similarities
Users of vConTACT3 versions 3.1.0+ (database version 230+) can generate average nucleotide identities (ANI) between genomes within predicted families.
Other Outputs
Supported formats:
Completeness (CSV): Estimated genome completeness based on genus-level groups
PyUpSet (SVG/PNG): Intersection plot of realms
Newick (NWK): Genome dendrograms
Centroids: Rank-group centroids
Example: Completeness Report (CSV)
Status |
Group |
Core Genes |
Core Gene Coverage |
Genes (calc) |
Genes (ref) |
PC Coverage (95% CI low) |
PC Coverage (95% CI high) |
|
|---|---|---|---|---|---|---|---|---|
NC_003214.2 |
Ref |
Betalipothrixvirus |
31 |
100.0 |
40 |
73 |
92.4 |
62.1 |
NC_010152.1 |
Ref |
Betalipothrixvirus |
31 |
100.0 |
63 |
66 |
145.5 |
97.8999 |
NC_010153.1 |
Ref |
Betalipothrixvirus |
31 |
100.0 |
43 |
57 |
99.3 |
66.8 |
Estimated completeness of genome clusters, useful for downstream prioritization.
Example: PyUpSet Plot of Realms
Forthcoming
Example: Newick
Forthcoming
Example: Rank-Group Centroids
Forthcoming